
Set up a Local SonarQube Instance for OSS - Chapter 2

SonarQube is an open-source platform developed by SonarSource that provides continuous inspection of code quality through static code analysis.
There are two ways to set up SonarQube analysis - you can select from the cloud solution (sonarcloud ) or install a SonarQube instance on your machine or a remote server. In the first chapter we set up a local SonarQube instance and ran the analysis for a simple JavaScript application
In this chapter, we will continue to work with the same application and add more features to it.
- The stack
- The scope
- Jest and Cypress configurations
- SonarQube configuration
- Example project
- Conclusion
The stack
JavaScript, TypeScript, Cypress, Jest, nyc, cypress-sonarqube-reporter, jest-sonar.
The scope
In this chapter, we will highlight the following features and how to set them up:
- Executing tests and creating SonarQube reports with the help of Jest and Cypress
- Including test coverage information in the SonarQube report
- Incorporating test case numbers in the SonarQube report
Jest and Cypress configurations
To show the test coverage statistics in the SonarQube report, we need to generate the coverage data first. We will use Jest and Cypress for that.
So, we will use Jest to cover our application with unit tests and Cypress to cover it with end-to-end tests. With some configuration, these tools can provide you with coverage data.
Jest configuration
To generate the coverage report for Jest we need to add the following configuration to the jest.config.js file:
import type { Config } from 'jest'

const config: Config = {
  /* This option tells Jest to collect the coverage data from our tests */
  collectCoverage: true,
  /* This option specifies where the coverage report will be saved */
  coverageDirectory: "coverage/jest"
}

export default config
Cypress configuration
To generate the coverage report for Cypress we need to add the following configuration to the cypress.config.js file:
import { defineConfig } from 'cypress'

export default defineConfig({
  env: {
    codeCoverage: {
      exclude: ['cypress/**/*.*', 'node_modules/**/*.*']
    }
  },
  e2e: {
    /* Application url */
    baseUrl: 'http://localhost:3000',
    setupNodeEvents(on, config) {
      /* This task is required to collect the coverage data, more - https://docs.cypress.io/guides/tooling/code-coverage */
      require('@cypress/code-coverage/task')(on, config);

      return config;
    }
  }
})
Optionally, you can specify the folder in which the Cypress coverage report will be generated. By default, it is coverage. The tool that generates reports for Cypress is called nyc , and to configure it, you can use the .nycrc file with the following configuration:
{
  "report-dir": "coverage/cypress"
}
Also, you need to instruct your application code to collect the coverage data, in this chapter we will not cover this topic. But you can find more information about it in the Cypress documentation or in our blog post - Combining Code Coverage Data From Multiple Testing Tools .
SonarQube configuration
From the first chapter you might be familiar with the sonar-project.properties file.
It is a configuration file for SonarQube. It contains the project metadata and the configuration for the analysis. In this chapter, we will add the test-related configurations to it.
Test coverage in the report
To show the test coverage in the SonarQube report, we need to add the following configuration to the sonar-project.properties file:
# Specifying the directories where the tests live
sonar.tests=__tests__,cypress/e2e

# Specifying the files containing code coverage
sonar.javascript.lcov.reportPaths=coverage/jest/lcov.info,coverage/cypress/lcov.info
In addition, you can fine-tune what you want or don’t want to be part of the scope of your scan. There are two properties which can help you with this - inclusions and exclusions.
An example of usage:
sonar.tests.inclusions=__tests__/**/*.test.ts,cypress/e2e/*.cy.ts
This configuration should be enough to see the test coverage in the report:

But, as you can see in this screenshot, in the place where the test cases are supposed to be counted there is a dash mark instead. Let’s fix it.
Test case count in the report
This feature sounds pretty straightforward. But it is not. The reason for that is that SonarQube doesn’t know how to count the test cases. It is up to us to provide the tool with the information about the test cases count.
To do that, we need to add some configuration details to our jest.config.js, cypress.config.js, and to the sonar-project.properties files.
Let’s start with the jest.config.js file. We need to add the following configuration to it:
{
  reporters: [
    "default",
    [
      "jest-sonar",
      {
        outputDirectory: "coverage/jest",
        outputName: "sonarqube-report.xml"
      }
    ]
  ]
}
In addition to the default reporter, we added the jest-sonar reporter. This reporter will generate the sonarqube-report.xml file in the coverage/jest directory. This file will contain information about all test cases that were run.
The coverage/jest/sonarqube-report.xml file will look like this:
<testExecutions version="1">
  <file path="__tests__/home.test.tsx">
    <testCase name="Home renders link to about page" duration="40" />
    <testCase name="Home page should display tested by jest" duration="8" />
    <testCase name="Home should test untested path" duration="5" />
    <testCase name="Home renders homepage unchanged" duration="3" />
  </file>
</testExecutions>
Now, we need to add the following configuration to the cypress.config.js file:
{
  reporter: 'cypress-sonarqube-reporter',
  reporterOptions: {
    outputDir: 'coverage/cypress/reports',
    mergeOutputDir: 'coverage/cypress',
    mergeFileName: 'sonarqube-report.xml',
    preserveSpecsDir: false
  },
  e2e: {
    baseUrl,
    setupNodeEvents(on, config) {
      /* Rest of the previous configuration. */
      on('after:run', (results) => {
        return require('cypress-sonarqube-reporter/mergeReports')(results);
      });
      return config;
    }
  }
}
In this configuration, we included the cypress-sonarqube-reporter reporter, which generates a sonarqube-report.xml file in the coverage/cypress/reports directory.
This file contains information about all executed test cases. To consolidate all reports from the coverage/cypress/reports directory into a single file, we added an after:run event listener.
This listener merges all reports into a single coverage/cypress/sonarqube-report.xml file, this is particularly useful when dealing with multiple test files.
By default, the preserveSpecsDir option is set to true, which replicates all directories preceding the test file under the coverage folder. However, for our purposes, having a single reports folder containing all reports is sufficient.
The coverage/cypress/sonarqube-report.xml file will look like this:
<?xml version="1.0" encoding="utf-8"?>
<testExecutions version="1">
  <file path="cypress/e2e/home.cy.ts">
    <testCase name="Navigation - should navigate to the about page" duration="685"></testCase>
    <testCase name="Navigation - should display - tested by cypress" duration="808"></testCase>
  </file>
</testExecutions>
And finally, we need to add the following configuration to the sonar-project.properties file:
sonar.testExecutionReportPaths=coverage/jest/sonarqube-report.xml,coverage/cypress/sonarqube-report.xml
This was a lot for a such small improvement, but now we can see the test cases count in the SonarQube report:
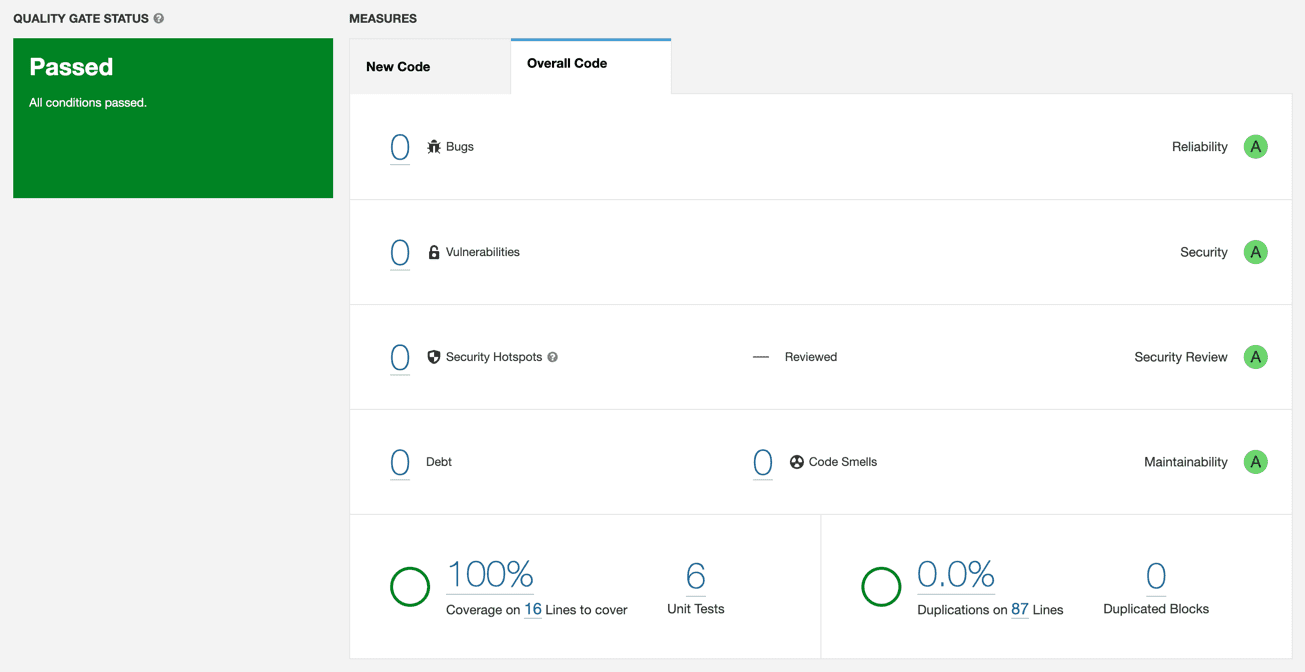
It is worth mentioning that the Unit tests count is not the same as the number of tests. Unit tests count is the number of assertions that were run.
For example, if you have a test containing two assertions, the Unit tests count will be 2. This number includes assertions from both sources - Jest and Cypress.
Example project
All the code from this blog post is available in the react-ssr-sonarqube-example repository.
You can clone it and follow the steps from this blog post to see the results for yourself.
Conclusion
This blog post provided an in-depth guide on configuring Jest and Cypress to work with SonarQube for a JavaScript/TypeScript application.
We demonstrated how to set up the necessary configurations for generating coverage reports, displaying test coverage and test cases count in the SonarQube report.
Although some steps might seem complex, having a well-configured SonarQube instance can significantly improve the quality and maintainability of your codebase.
Upgrade.js can also help improve the quality and maintainability of your code base. Contact us if you would like to learn more.