
Combining Code Coverage Data From Multiple Testing Tools

When we test our applications, it’s often useful to use more than one tool or framework for different kinds of tests.
For example, in a Backend-for-Frontend (BFF) application, we may have end-to-end (e2e) tests and unit tests. We might use a tool like Cypress for e2e testing and Jest for unit testing.
Each of these tools can produce a test coverage report, but wouldn’t it be nice to be able to combine all our test coverage data into one report? With IstanbulJS , we can!
In this article, I’ll show you how.
- The stack
- Beginning of the journey
- Getting Cypress coverage data
- Implementation: First try
- Implementation: Second try
- A couple of additional circles
- Conclusion
The stack
- IstanbulJS - a code coverage tool for JavaScript for consistent code coverage reporting for most JavaScript test libraries. IstanbulJS “instruments” the code under test, adding code that will track coverage metrics during the test run
- nyc - command-line client for IstanbulJS that helps track code coverage of JavaScript codebase
- babel-plugin-istanbul - Babel plugin for instrumenting code for coverage reporting
- @lcov-viewer/istanbul-report - code coverage HTML report generator for IstanbulJS
- Cypress - E2E testing framework for web applications
- @cypress/code-coverage - plugin for Cypress to collect coverage data
- Jest - JavaScript testing framework for unit tests
Beginning of the journey
As we mentioned earlier, we have a BFF application, and we want to collect E2E and unit tests code coverage data. The key point here is that configurations for Jest and Cypress were already in place, and we will use them for further needs.
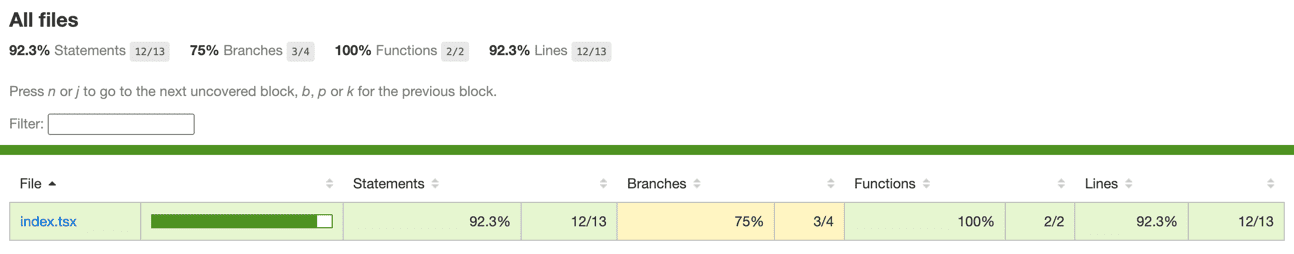
Code coverage data from the unit tests can be retrieved pretty easily. When using Jest,
you need to add only one line in the configuration file - collectCoverage: true. After passing
all the tests, Jest will create a coverage folder with the desired coverage data.
Jest's coverage report
Getting Cypress coverage data
Unlike Jest, Cypress does not have built-in support for code coverage reporting. But, with the help of IstanbulJS and @cypress/code-coverage, we can overcome this!
Code coverage is typically calculated by instrumenting the code being tested. Instrumenting is a process that inserts tracking code into the code under test, to produce metrics about how and when that code is executed. So when we run our test tools against instrumented code we can capture data about which code gets executed and which does not.
Implementation: First try
We encountered an issue with Cypress where we only received the default console output for passed tests, but not the code coverage data we expected in an output file. We found the relevant documentation on E2E code coverage and discovered the @cypress/code-coverage plugin. After installing and configuring the plugin as described in the documentation, we still only received test results in the console.
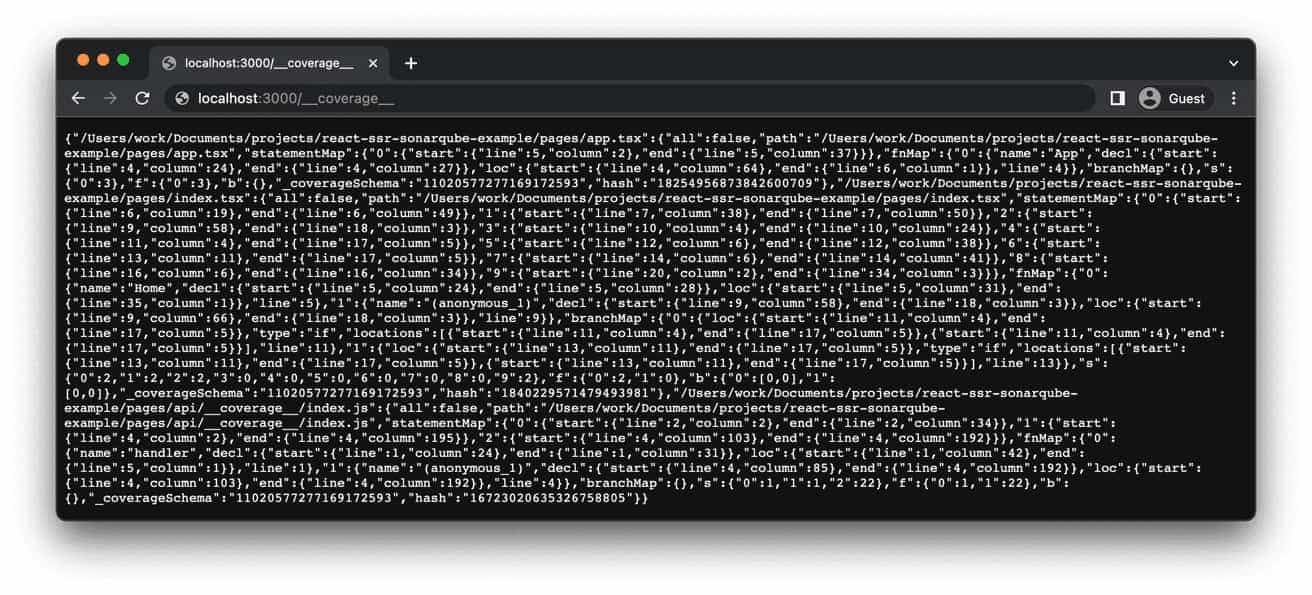
To troubleshoot the issue, we checked the __coverage__ object in the browser’s developer console for our app’s local host URL. We found that the object didn’t exist, which led us to realize that our app’s source code wasn’t instrumented.
Following the guide on instrumenting code, we decided to use babel-plugin-istanbul to avoid rebuilding the entire application every time we made changes. Our application already had a Babel configuration, so adding the plugin was simple.
Configuration steps
Install the plugin:
npm add -D babel-plugin-istanbul
Add the plugin to the .babelrc configuration file:
{
  "plugins": ["istanbul"]
}
After instrumenting the code, we checked the test results again, but we still only received the console output for passed tests, and no coverage folder was created.
Implementation: Second try
After further debugging our code, we discovered an error in the console where the app was being served while the E2E tests ran. The error
was - Page not found: /__coverage__. At this point, we realized we must have missed something important.
We returned to the code coverage documentation page and found a section discussing Full-stack code coverage , which was exactly what we needed since we were working with a BFF application.
Following the configuration steps outlined in the Full-stack applications section was fairly simple because we were using an Express application to serve our app. After completing these steps, we finally received the expected output from Cypress.
Configuration steps
Add new script to the package.json file:
{
  "scripts": {
    "dev:coverage": "nyc --silent node ./src/server.js"
  }
}
Add a new middleware to our server.js file on demand:
if (global.__coverage__) {
  require('@cypress/code-coverage/middleware/express')(app);
}
Add coverage configuration object to the cypress.config.js file:
const { defineConfig } = require('cypress')

module.exports = defineConfig({
  env: {
    codeCoverage: {
      url: 'http://localhost:3000/__coverage__'
    }
  }
})
Instrumented data
Cypress' coverage report
A couple of additional circles
We now had both outputs and needed to create a single file that would contain the merged coverage data and display the complete and accurate coverage information. To accomplish this, we used the IstanbulJS CLI called nyc.
The execution command looked like this:
nyc merge <path of the folder with the original coverage files> <path where to store the merged output file>
However, after running the command, we encountered an error stating that one of the input files couldn’t be parsed.
This issue seemed to be a version mismatch between the reports created by Jest and Cypress. We investigated the libraries responsible for generating the reports for each framework and discovered that both Jest and Cypress were using istanbul-lib-coverage. However, Jest’s version was significantly older than Cypress’s version. To resolve the issue, we decided to upgrade Jest to the latest version, as it had a matching major version for istanbul-lib-coverage, which aligned with the version used by Cypress.
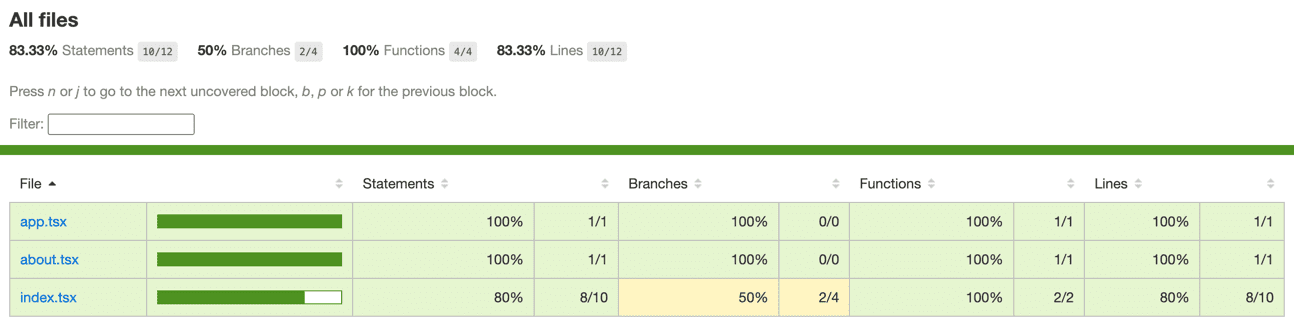
After upgrading and regenerating the coverage output for unit tests, the nyc merge command executed successfully and provided the desired output file. Satisfied with the result, we proceeded to review the output in a human-readable format, only to discover that the data was merged improperly. Comparing the input and output files, we found that the data had merged improperly. Lines that were fully covered by unit tests and marked as such in the unit test output file appeared as uncovered in the merged output file.
Merged coverage report (incorrect)
The merged report was incorrect because after combining the coverage data into a single report, it should have displayed 100% coverage.
We spent some time debugging this issue and discovered that instead of using the nyc merge command, we could use the nyc report command to generate the report from the coverage data. The command looked like this:
nyc report --reporter=html --temp-directory <path of the folder with the original coverage files> --report-dir=<path where to store the merged output file>
The output of this command was different from the nyc merge command but still incorrect. We checked the nyc source code repository and found numerous open issues related to merging coverage data. There were a few solutions mentioned in the comments of these issues, but unfortunately, none of them worked for us.
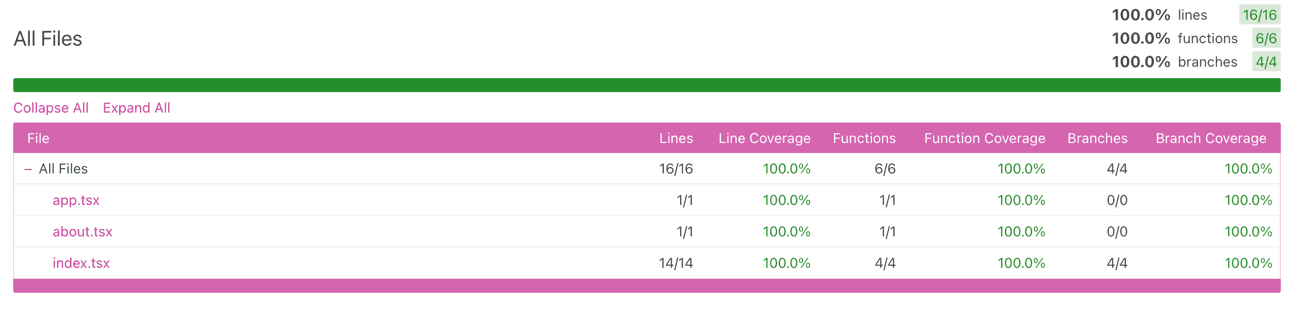
Merged coverage report (correct)
We were primarily concerned with the coverage percentage, so we decided not to spend too much time investigating the issue with the reports generated by the default nyc reporters. Instead, we looked for another tool that could display the coverage data in a human-readable format.
We discovered an actively maintained tool called LCOV viewer , which is specifically designed for viewing lcov report files. Upon reviewing the documentation, we found that the repository also provides an Istanbul report generator . This meant that it could be used alongside nyc as a reporter!
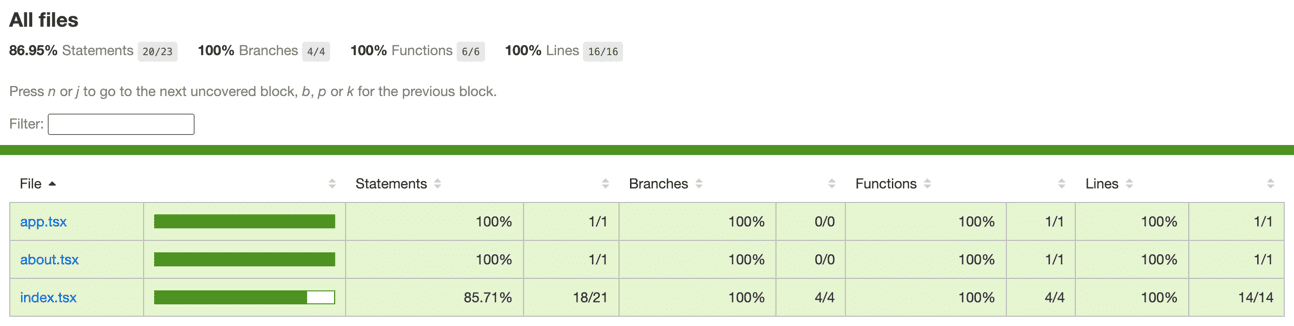
By modifying the nyc command to generate the report using the @lcov-viewer/istanbul-report reporter, we finally achieved the desired output.
The final command:
nyc report --reporter=@lcov-viewer/istanbul-report --temp-directory <path of the folder with the original coverage files> --report-dir=<path where to store the merged output file>
And the desired output:
Conclusion
Successfully tackling this intricate issue serves as a useful reminder to use documentation effectively and carefully read it. Moreover, it is important to note that ensuring third-party dependencies are up-to-date is crucial in avoiding potential maintenance issues. Proactively addressing updates will enable timely resolution of problems as they arise, preventing them from accumulating and causing further complications. Neglecting to update dependencies may lead to spending a significant amount of time resolving various issues within the project.
We can help you in keeping your JavaScript application up to date !