
Using ES6-Plato to investigate the Express code base

When upgrading, or paying off tech debt for an application it is important to note that each case requires a distinct strategy. In this experiment, we will explore how the investigation process can be carried out on Express using es6-plato .
- Tools
- Report Overview
- LOC
- Complexity
- Maintainability, Difficulty, and Estimated errors in implementation
- ESLint errors
- Churn
- Conclusion
Tools
The JavaScript ecosystem is known for its diversity in possible configurations and development methods, which can make it challenging to establish a static set of steps or tools that can be applied to all projects in the field.
Additionally, due to the variability of the ecosystem, it can be difficult to find well-maintained open-source solutions with the desired features for a specific project.
As a result, each project may require a unique approach, and inspecting a JS/TS application may be limited by the availability of suitable open-source solutions.
Nevertheless, today we will consider the following open source projects: es6-plato and ESLint . The ESLint configuration will use the following plugins: eslint-plugin-abcsize , eslint-plugin-n , eslint-plugin-security , eslint-plugin-security-rules , eslint-plugin-sonarjs . We will consider each plugin in detail in the ESLint errors section.
es6-plato is a valuable tool that generates an HTML report detailing various metrics and helpful information about the targeted project.
It provides information such as lines of code, complexity, maintainability, difficulty, estimated errors, and ESLint errors.
Additionally, we implemented the support of churn and churn vs complexity metrics in our fork and created a pull request with this feature in the original repository.
It is worth mentioning that some metrics are subjective, and you need to be careful about making any decisions based on them.
Report Overview
The es6-plato report has 3 pages: Home, File details, and Summary.
Home page
File details page
Summary page
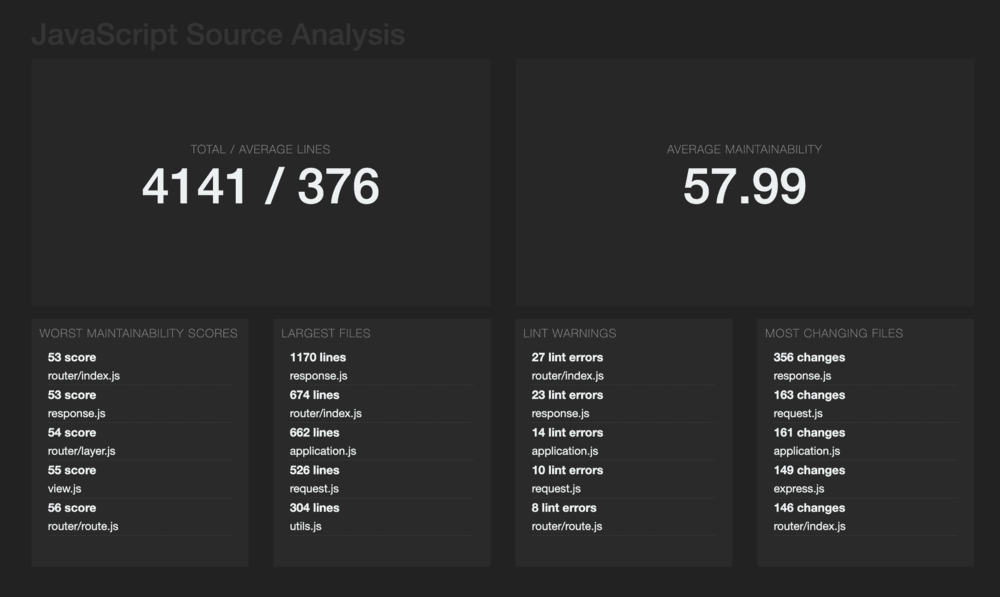
We will consider all the sections shown on these pages further in this blog post.
LOC
The es6-plato library produces an output that includes lines of code (LOC) metric.
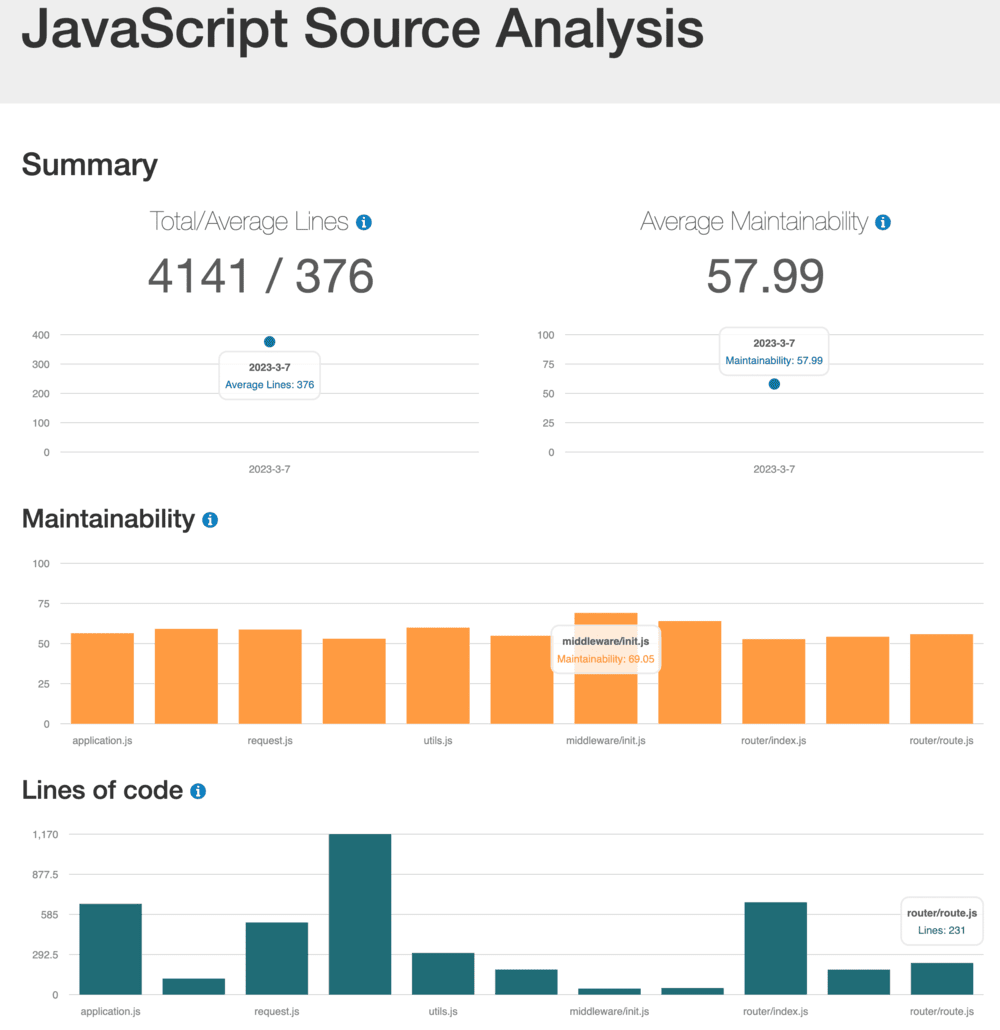
This metric is pretty straightforward to compute and explore, so let us start with it. When we inspect the express/lib folder (the folder where the source code lives), we can see the following results, as shown in the screenshot.
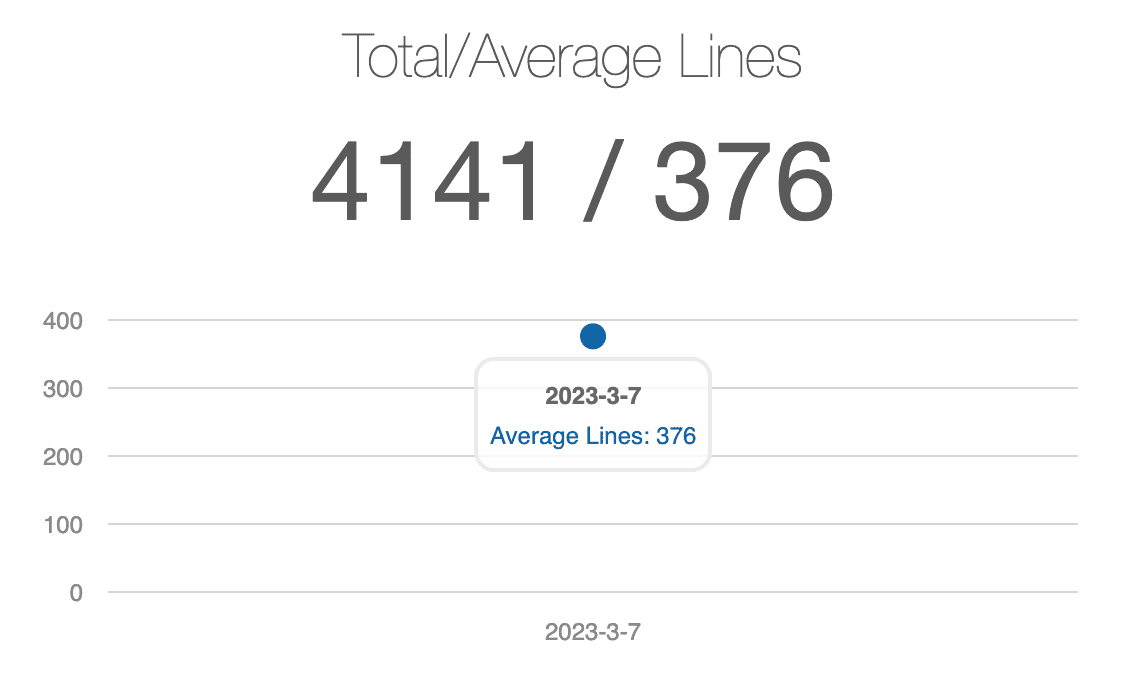
It’s hard to believe that one of the most widely-used web server frameworks is made up of just 4k lines of code.
Moreover, in addition to providing the total/average lines metric, es6-plato also presents a graph depicting the number of lines of code per file.
This graph can assist in identifying which files contain an excessive amount of code, making them potential candidates for further refactoring.
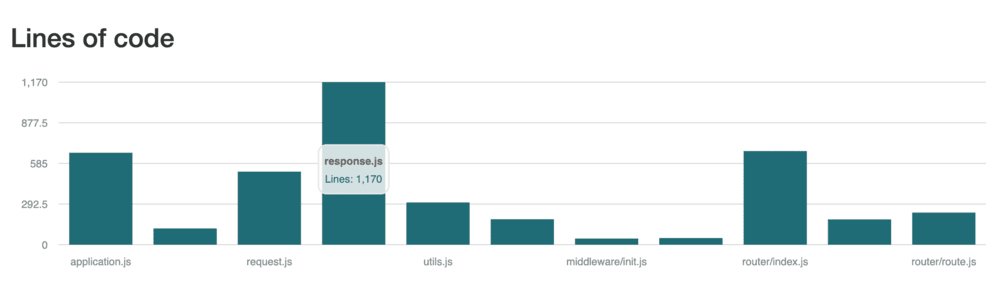
By referring to this graph, it is possible to identify the largest files within the application and subsequently examine their implementation in order to find opportunities to reduce their size.
This assessment can help to determine whether such a reduction is worthwhile, both in terms of improving the application’s maintainability and making it easier to manage.
This metric serves as the starting point for this article, where we identify files that warrant a closer look. As indicated, the
response.jsfile has the largest number of lines of code. However, we are not suggesting that files should have a specific maximum length, as each file should be long enough to implement the corresponding entity appropriately. In accordance with the Single Responsibility principle, it is possible that a single unit handling complex logic may be quite lengthy, leaving little opportunity for making it shorter.
Complexity
The es6-plato library utilizes Cyclomatic as the complexity type metric. This metric calculates the number of unique paths through a code block. We can approach the results in a couple of ways:
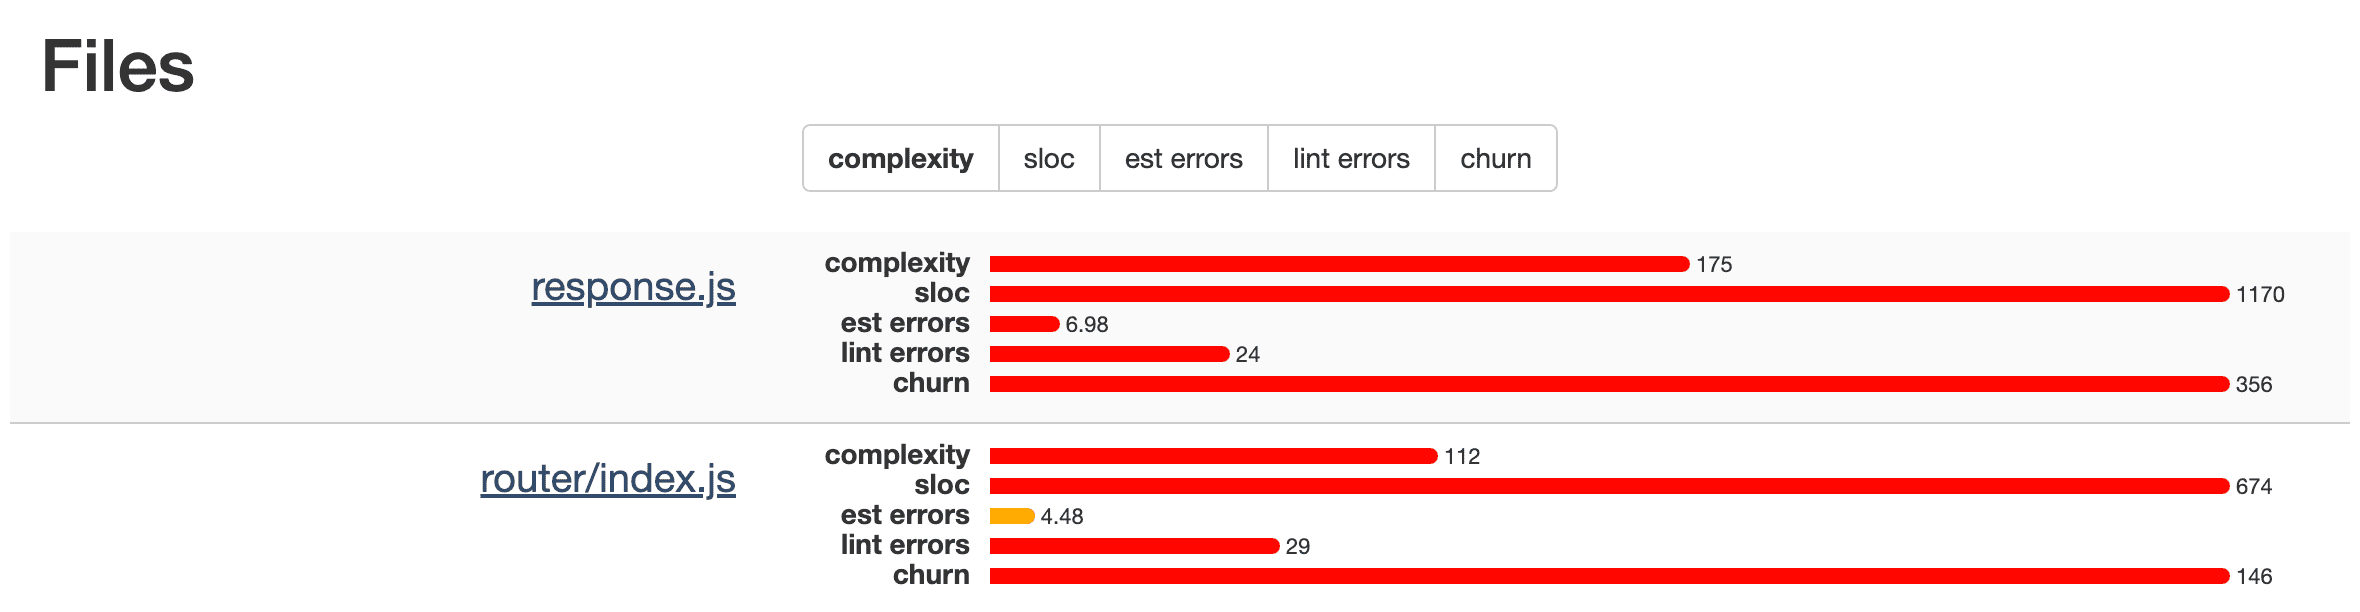
- the files list view features a line displaying the numerical value that represents the complexity of each file. To simplify navigation, this section contains buttons that enable the list of files to be sorted by the desired metric;
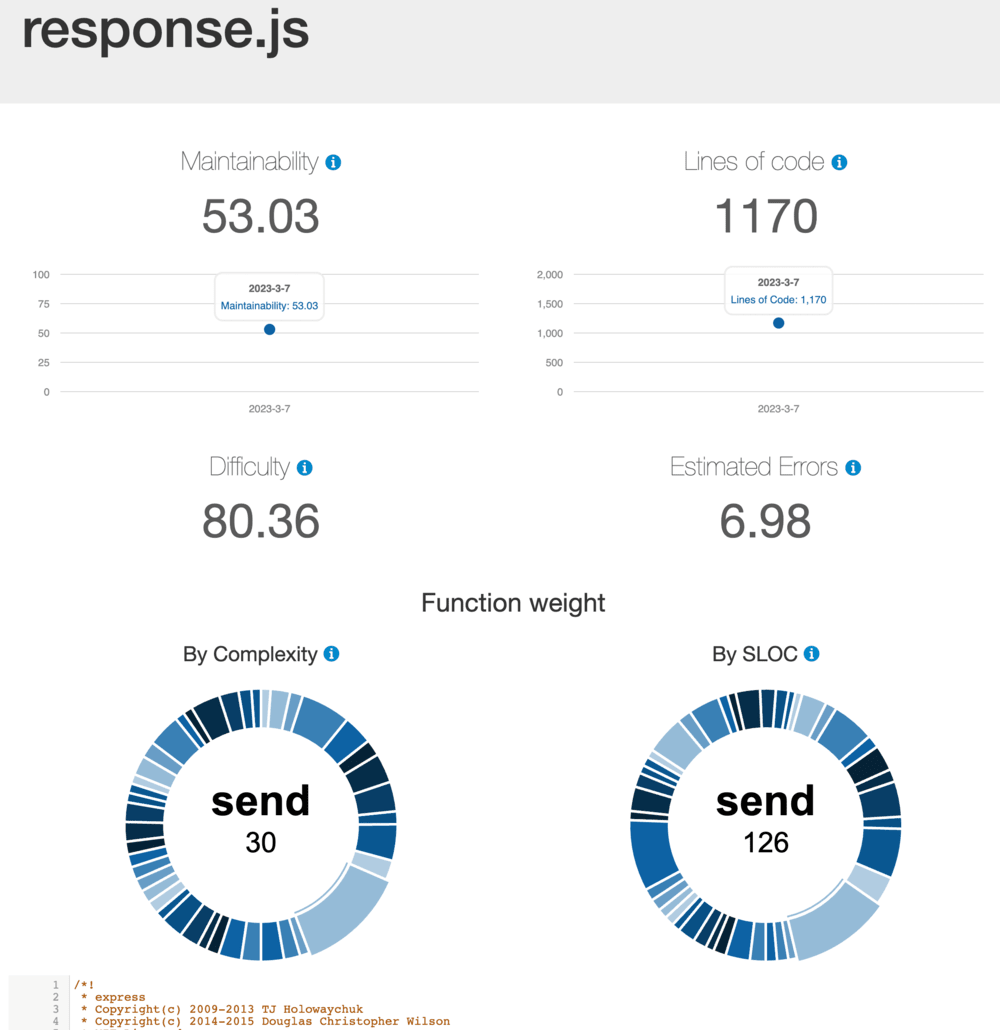
- on the file details page, a circular chart displays the numerical values representing the complexity of each function in the file. This chart facilitates navigation to each function by allowing you to click on the corresponding chart item.
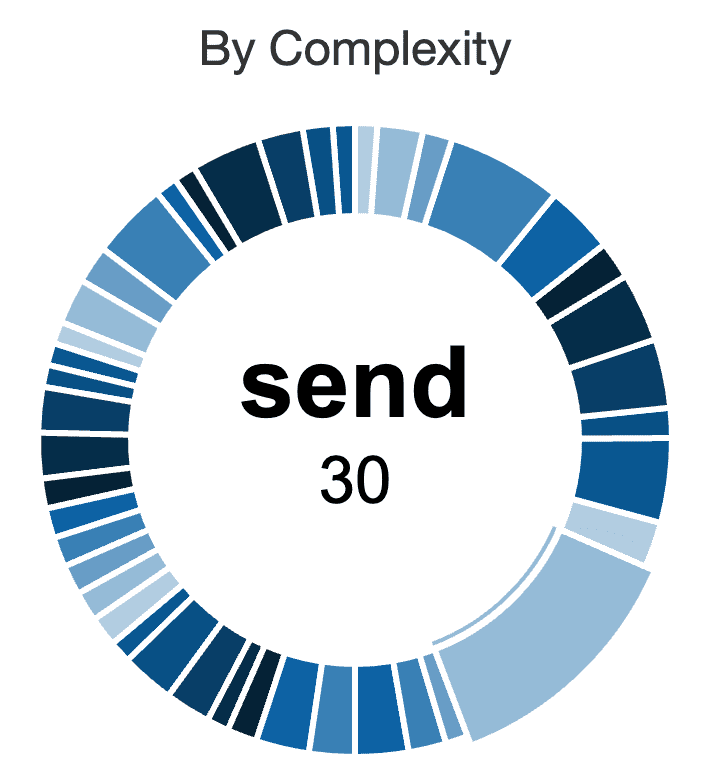
There is one more place where this metric can be found and where it is applied, but we will talk about it in one of the following sections.
By observing closely, you will notice that the file with the highest complexity score (the list is sorted by complexity metric) is also the file that was previously identified as having the most lines of code and it is
response.js. This correlation may serve as an initial indication that a refactoring effort could be beneficial in reducing both of these metrics.
Maintainability, Difficulty, and Estimated errors in implementation
The reason why these metrics are grouped together under one blog section is that they all use certain “magic” numbers in their formulas, and they are all calculated using another project - escomplex-plugin-metrics-module . You can find the sources for the metrics here: maintainability , estimated errors in implementation , and difficulty .
While these metrics can be used to compare files, they should not be solely relied upon to predict or decide a file’s maintainability, difficulty, or number of errors in implementation. Other factors, such as churn and an individual file’s examination from a professional perspective, must also be taken into account.
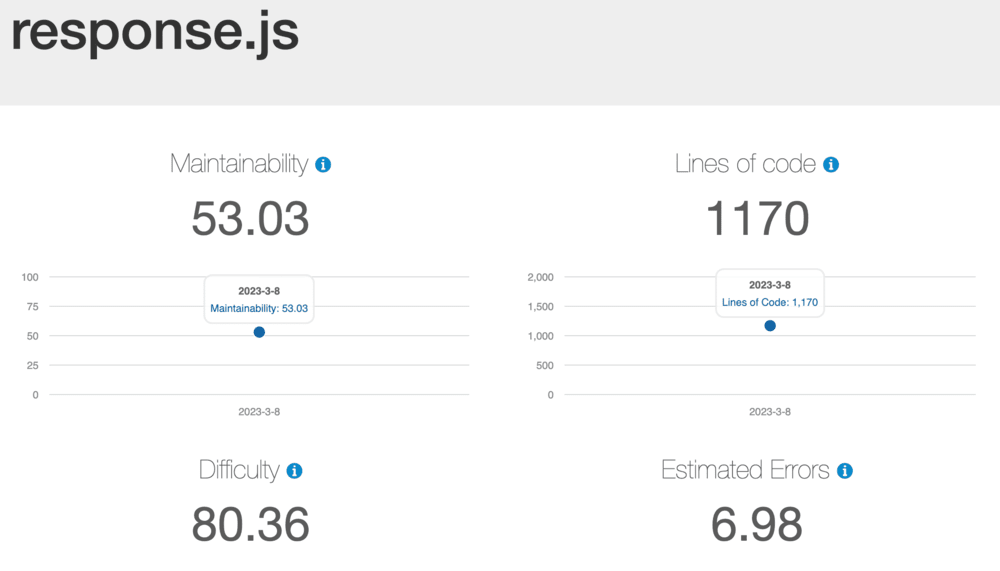
The
response.jsfile ranks as the second-worst in terms of maintainability, the most difficult to handle, and the highest in the estimated number of errors. These consistent statistics suggest a recurring pattern with this file. Therefore, despite the use of “magic” numbers in generating metrics discussed in this section, it may be appropriate to raise our confidence in their accuracy. This is especially true since these metrics are supported by other independent metrics.
ESLint errors
Static code analysis is an important process in software development that involves examining the source code of a program without actually executing it.
The main goal of static code analysis is to identify potential issues and vulnerabilities in the code that could cause problems during runtime or lead to security breaches.
By using a tool like ESLint , developers can check their code against a set of predefined rules and best practices to ensure that it is free of common mistakes and potential bugs.
ESLint is a particularly good choice for static code analysis because it is highly customizable and can be configured to work with a variety of different programming languages and frameworks.
There are two ways to check for found static code analysis errors in an application using es6-plato .
The first option is the default behavior, which utilizes pre-configured ESLint settings to analyze the target project. Alternatively, you can indicate the location of your custom ESLint configuration file to be applied during the inspection process.
During upgrades, our target is to find all problematic places but especially security issues and vulnerabilities. For this inspection, we used the following ESLint configuration:
{
    "globals": {
        "module": true,
        "exports": true,
        "process": true,
        "require": true
    },
    "extends": [
        "plugin:security/recommended",
        "plugin:security-rules/recommended",
        "plugin:abcsize/recommended",
        "plugin:sonarjs/recommended",
        "plugin:n/recommended"
    ],
    "plugins": [
        "sonarjs",
        "abcsize"
    ]
}
Rules from the configuration:
-
eslint-plugin-abcsize - calculates the Assignment/Branch/Condition Size Metric ;
-
eslint-plugin-n - a great collection of rules for
Node.js; -
eslint-plugin-security - a group of rules focusing on
Node.jssecurity; -
eslint-plugin-security-rules - a bunch of rules focusing on web development security;
-
eslint-plugin-sonarjs - a set of rules used in SonarJS to detect bugs and suspicious patterns in the code.
As a result, we can explore the files list view to see how many errors each file has:
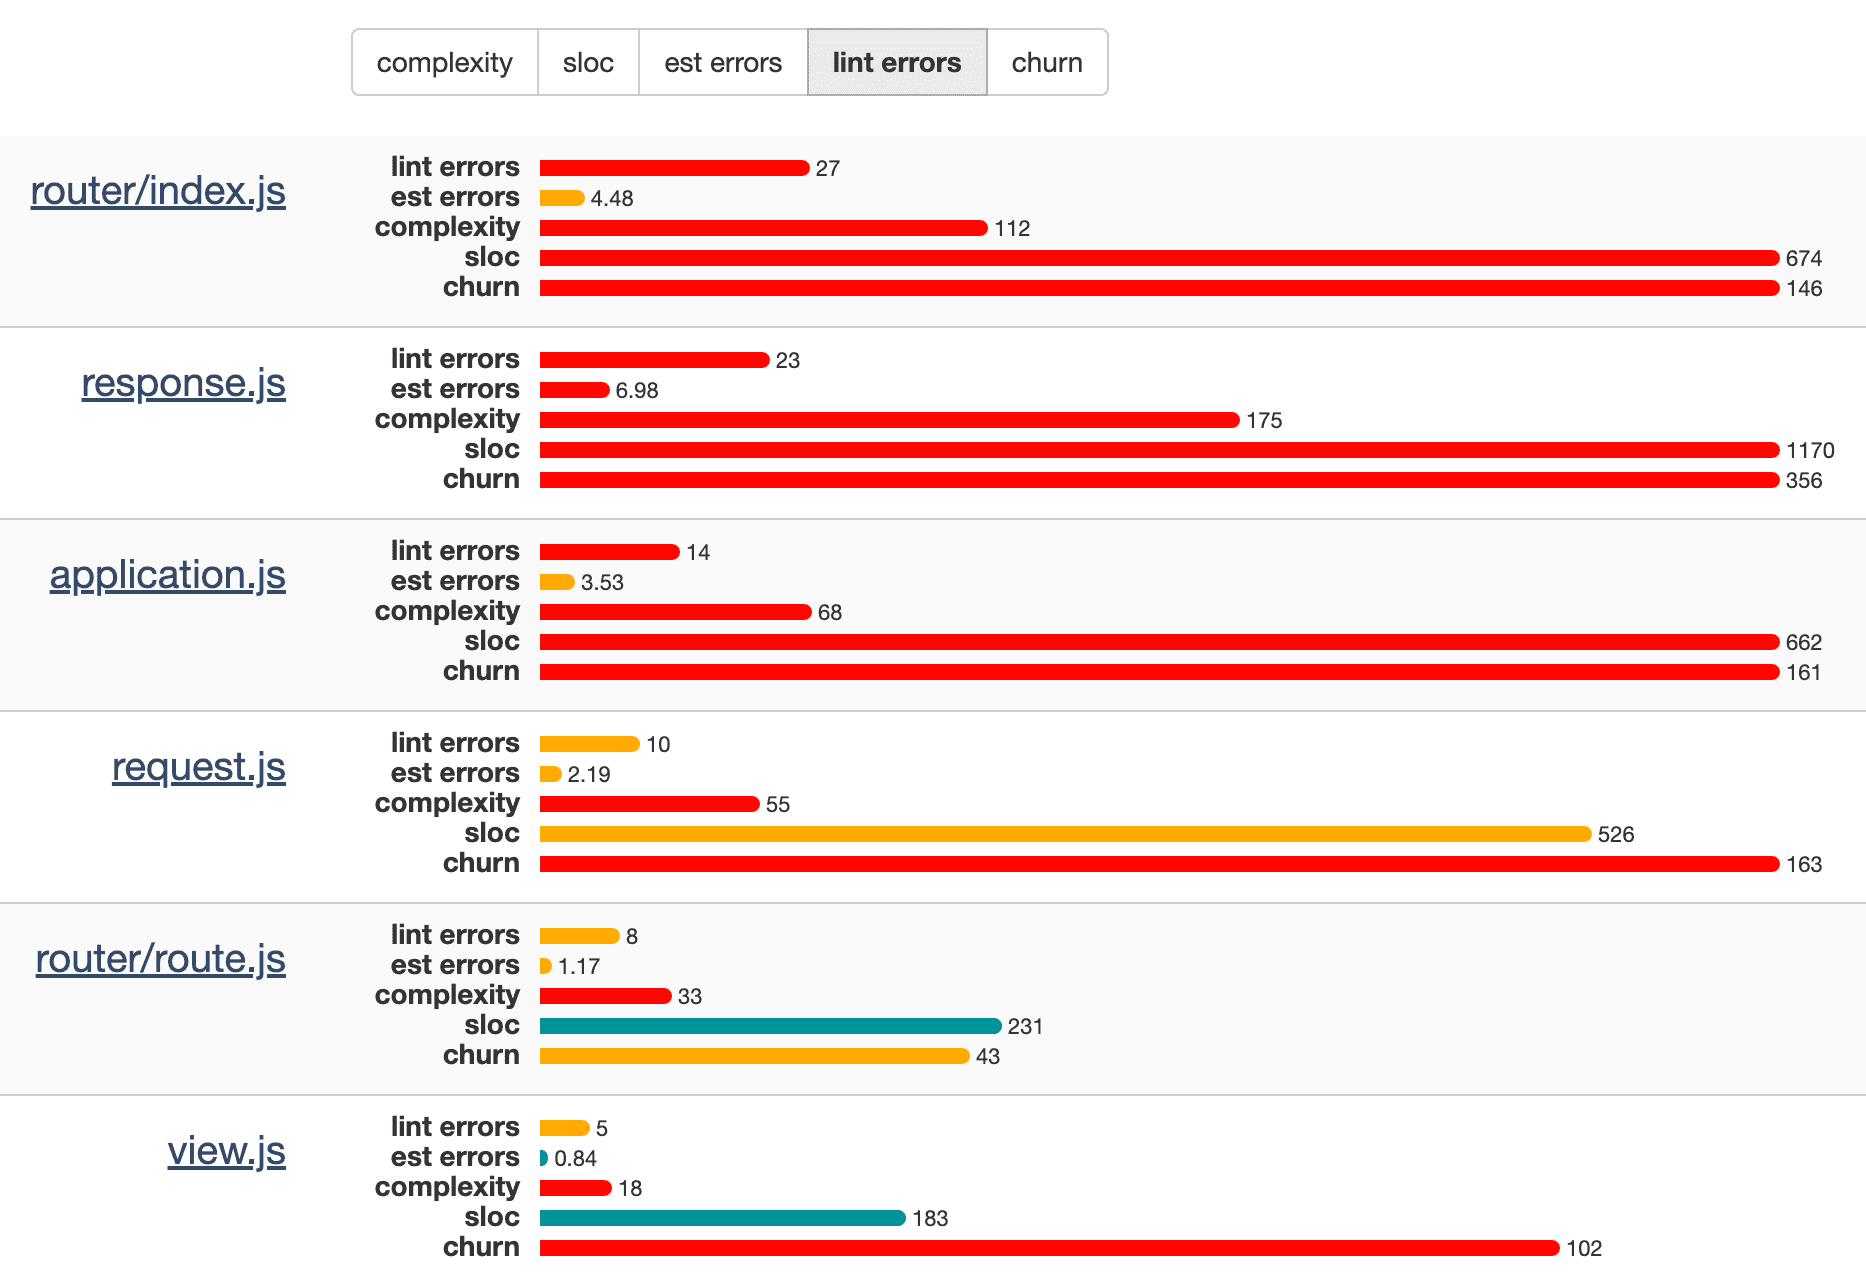
Also, we can navigate to the file details page, and we will see the file’s source code with the error messages if any. Here is a simple example of what the error may look like:

es6-plato has the capability to handle both JavaScript and TypeScript projects, but it can only properly display syntax highlighting for JS projects. Reserved words and interface/type names in TS may be displayed as plain text.
In this section, the
router/index.jsfile emerges as the top contender among the problematic files, coming in second place overall based on multiple metrics.
Churn
The churn metric is a measure of the amount of code added, modified, or removed in software development over a specific period of time. It is an indicator of the health of a codebase, with high churn indicating potential instability or poor quality, and low churn indicating relative stability and ease of maintenance.
Churn can be measured in various ways, such as lines of code, files changed, or commits made, and can be tracked over time to identify trends and inform decisions about code quality, architecture, and development processes.
As previously mentioned, the latest version of es6-plato did not include the churn metric. Therefore, we decided to add it as it could provide additional information before making any decisions, predictions, or estimations about future upgrades.
To retrieve churn data from the target project easier we created a module - git-churn-js . It provides JavaScript API for integration into the JS/TS projects.
You only need to specify the path where the .git folder lives in the target project and then ask to return the churn for desired files. The representation of the churn metric was added in two locations: the files list view, which displays the number of commits per file, and the chart that illustrates the churn vs complexity statistic.
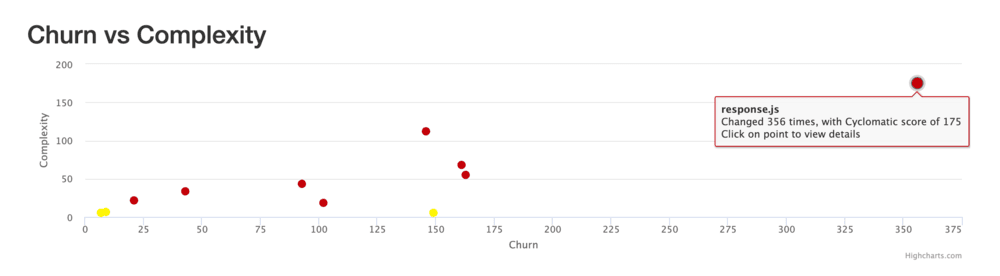
The chart may show different patterns or trends, such as files with high complexity and high churn, which can be a sign of potential problems, or files with low complexity and low churn, which may be easier to maintain.
The chart can also help identify outliers or areas where improvements can be made, such as files with high complexity but low churn, which may indicate that the code is difficult to change or that developers are avoiding working on it.
This chart provides further evidence that the
response.jsfile is highly complex and undergoes frequent changes. It is desirable for files to appear as close to the bottom-left corner of the graph as possible, and it may be worthwhile to perform some refactoring to achieve this distribution.
Conclusion
After conducting an inspection, we discovered that the Express library doesn’t have tons of files, but some of these files are quite intricate.
Additionally, the frequent changes to these files make them challenging to maintain without undergoing some refactoring aimed at reducing their complexity. The pattern shown in this blog post may be applied recursively for all other files after addressing issues with the current most problematic file.
That being said, es6-plato can help developers stay up-to-date with the status of their projects through its visually appealing representation of project metrics.
Its ease of use makes it an ideal tool for developers to use for upgrades, refactoring, or improvements in their code. By using es6-plato, developers can gain insights into the overall health of their projects, identify areas for improvement, and make informed decisions to enhance their code bases.
If you are struggling with an upgrade or refactor feel free to reach out to Upgrade.js for help.