
Getting a Better 'Picture' of Your Application Architecture

In a previous post, I covered some useful static code analysis tools for getting a sense of the size of a Node.js application, as well as the health of its external dependencies. This post will continue to look at static analysis tools, with a focus on understanding and visualizing the application’s architecture, patterns (good and bad), and internal dependencies.
A well architected application will have loose coupling and high cohesion . A full discussion of these principles is outside the scope of this article but, in short, coupling refers to how dependent a module is on other modules to do its job, and cohesion refers to how focused and organized a module is. A module should be highly focused on a single pupose (high cohesion), and not overly aware of, or dependent on, other modules (loosely coupled). Circular dependencies, where two or more modules call back and forth to each other, can also indicate a design concern. Nothing can really replace digging in and reviewing actual code, but static analysis tools can help us gain some higher level insights into an application, and guide us toward areas we may want to investigate further.
The two tools I want to focus on in this article are Madge and Dependency Cruiser . Both are helpful for visualizing the structure of an application and how various modules interact with each other. Both tools offer a command line interface (CLI) as well as an API that can be used in code. Madge is Javascript/Typescript-focused, easy to get up and running, and can generate a textual list of dependencies as well as a visual graph in JPG, or by adding Graphviz, SVG and DOT formats. Dependency Cruiser is a bit more robust, supporting multiple languages, visualization options, and more robust CI integration, allowing you to set custom rules about which modules can communicate and which can’t, and to cause build errors on circular dependencies, etc.
Madge
Madge is simple and easy-to-use to generate visual dependency graphs, making it simple to understand the relationships between your project’s modules. It can help identify circular dependencies, and gain insights into a project’s overall structure.
To get started, follow the instructions for installing Madge , and optionally Graphviz if you would like additional visualization options. As we did in the previous post, we will start with a popular and fairly simple project, Express .
By default, Madge will output a nested list of dependencies like so:
$ npx madge ./lib/
Processed 11 files (323ms)

application.js
  middleware/init.js
  middleware/query.js
  router/index.js
  utils.js
  view.js
express.js
  application.js
  middleware/query.js
  request.js
  response.js
  router/index.js
  router/route.js
middleware/init.js
middleware/query.js
request.js
response.js
  utils.js
router/index.js
  router/layer.js
  router/route.js
router/layer.js
router/route.js
  router/layer.js
utils.js
view.js
While this is useful, a visual diagram is a little easier to follow. To output a dependency graph as a JPG image, we can use this command:
npx madge ./lib/ -i madge.jpg
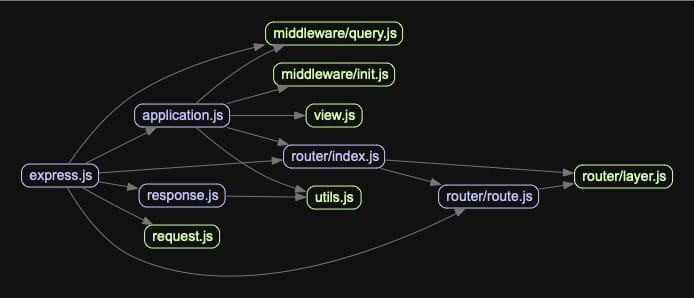
Here we can see a fairly simple architecture with dependencies flowing left to right. They are color coded: green nodes have no dependencies, purple nodes have one or more dependencies, and red nodes have circular dependencies, which are typically undesirable, and thankfully are not present in this diagram.
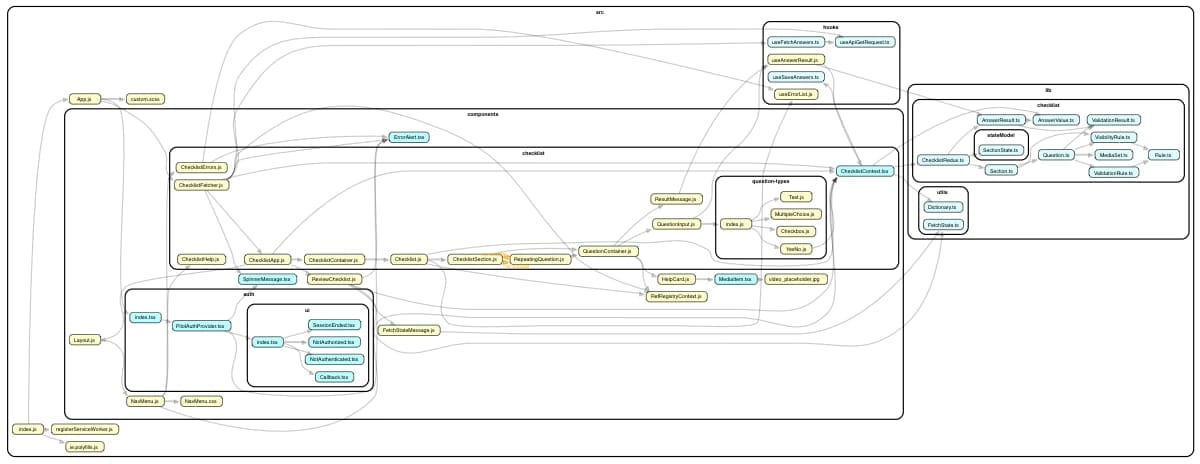
Unfortunately, for larger projects, Madge’s default visualizations can get pretty unwieldy. I ran Madge on a larger, messier project and the resulting graph was pretty huge and hard to read (you can click to open in new tab):
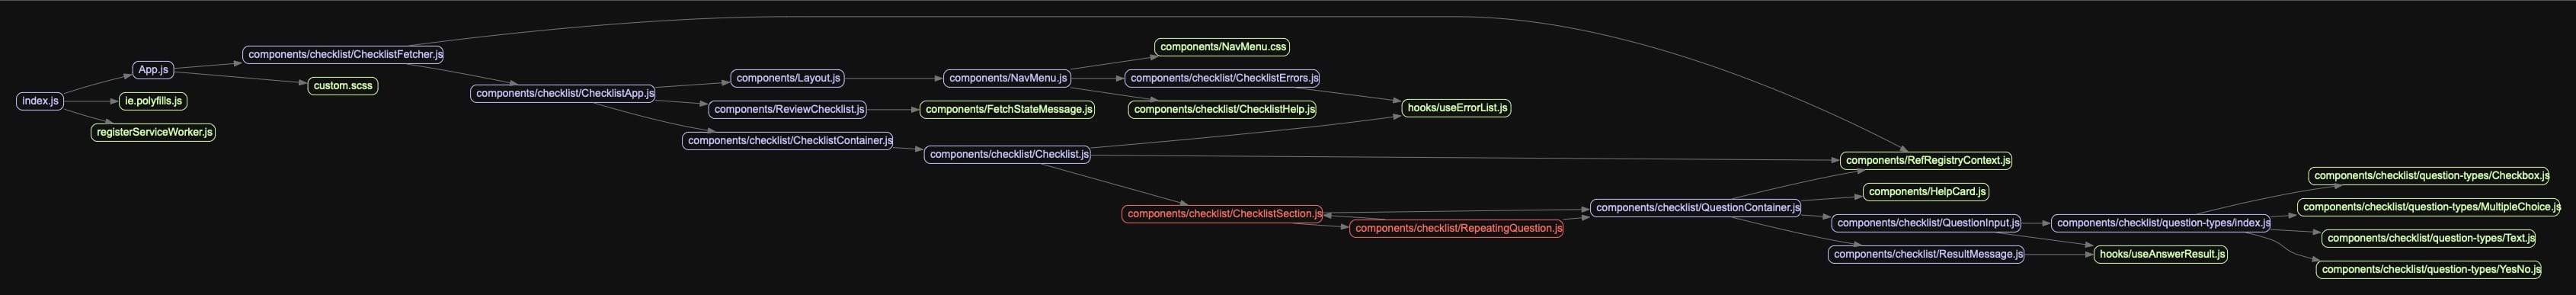
If you look closely, though, you will notice that it did identify a circular dependency between nodes that might need to be looked at!
Dependency Cruiser
Dependency Cruiser
Dependency Cruiser has a lot of overlap with Madge, but provides a few more features that can be very useful. Before we get into those, let’s compare the dependency visualization output of Dependency Cruiser to that of Madge above. First, we’ll follow the installation instructions . Then, we’ll return to our express repository:
$ npx depcruise -T text --include-only lib/ lib/
lib/application.js → lib/middleware/init.js
lib/application.js → lib/middleware/query.js
lib/application.js → lib/router/index.js
lib/application.js → lib/utils.js
lib/application.js → lib/view.js
lib/middleware/query.js → node_modules/qs/lib/index.js
node_modules/qs/lib/index.js → node_modules/qs/lib/formats.js
node_modules/qs/lib/index.js → node_modules/qs/lib/parse.js
node_modules/qs/lib/index.js → node_modules/qs/lib/stringify.js
node_modules/qs/lib/parse.js → node_modules/qs/lib/utils.js
node_modules/qs/lib/utils.js → node_modules/qs/lib/formats.js
node_modules/qs/lib/stringify.js → node_modules/qs/lib/formats.js
node_modules/qs/lib/stringify.js → node_modules/qs/lib/utils.js
lib/router/index.js → lib/router/layer.js
lib/router/index.js → lib/router/route.js
lib/router/route.js → lib/router/layer.js
lib/utils.js → node_modules/qs/lib/index.js
lib/express.js → lib/application.js
lib/express.js → lib/middleware/query.js
lib/express.js → lib/request.js
lib/express.js → lib/response.js
lib/express.js → lib/router/index.js
lib/express.js → lib/router/route.js
lib/response.js → lib/utils.js
I actually prefer Madge’s nested output, but we can see they are showing essentially the same thing. And to compare apples to apples, we can generate a visual dependency graph similar to Madge’s with this command:
$ npx depcruise -T dot --include-only lib lib | dot -T svg > depgraph.svg
Here we have to directly pipe to Graphviz (separate install) to output an SVG format which we can then view in Chrome, or other browser that supports direct display of SVGs (Safari did not do a great job for me!).
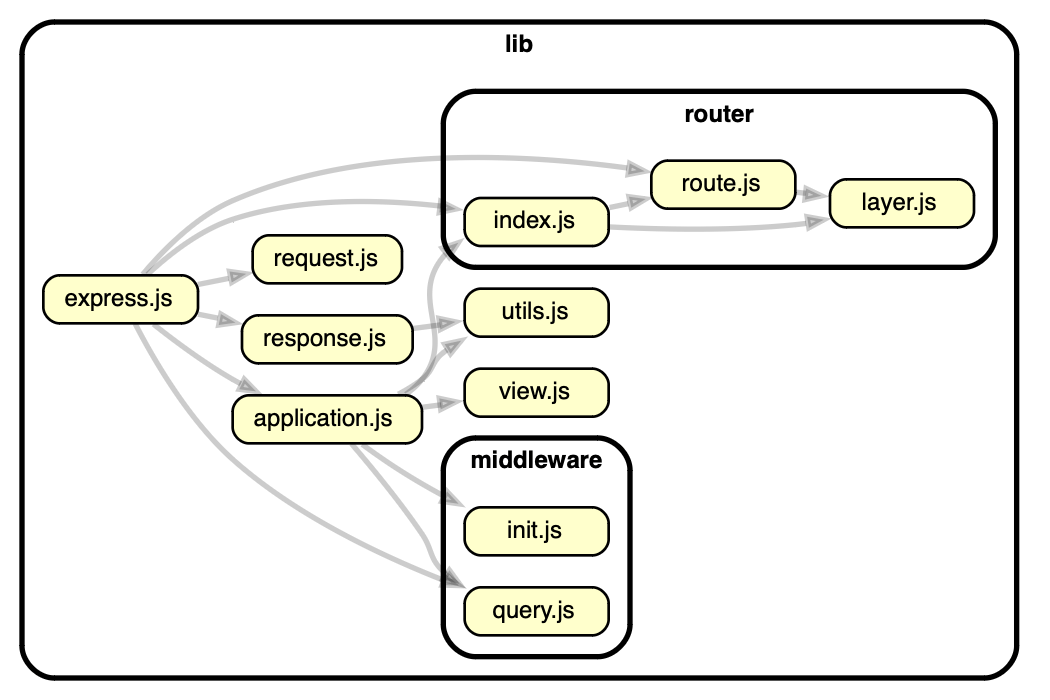
Now this view I like a little better than Madge’s output. The added directory boundaries are helpful for visualizing where the code lives. Other than that it’s pretty similar.
But wait! Dependency Cruiser offers much more than this. First, by piping output through a few more steps, we can generate a navigable HTML report!
$ npx depcruise -T dot lib | dot -T svg | npx depcruise-wrap-stream-in-html > dependency-graph.html
Here I’m choosing to not restrict it to --include-only source files, which will allow it to include node_modules dependencies in the view as well. We have to create the SVG format then pipe through depcruise-wrap-stream-in-html, which is a utility included in Dependency Cruiser, and then we create something that looks like this (click to view the full report):
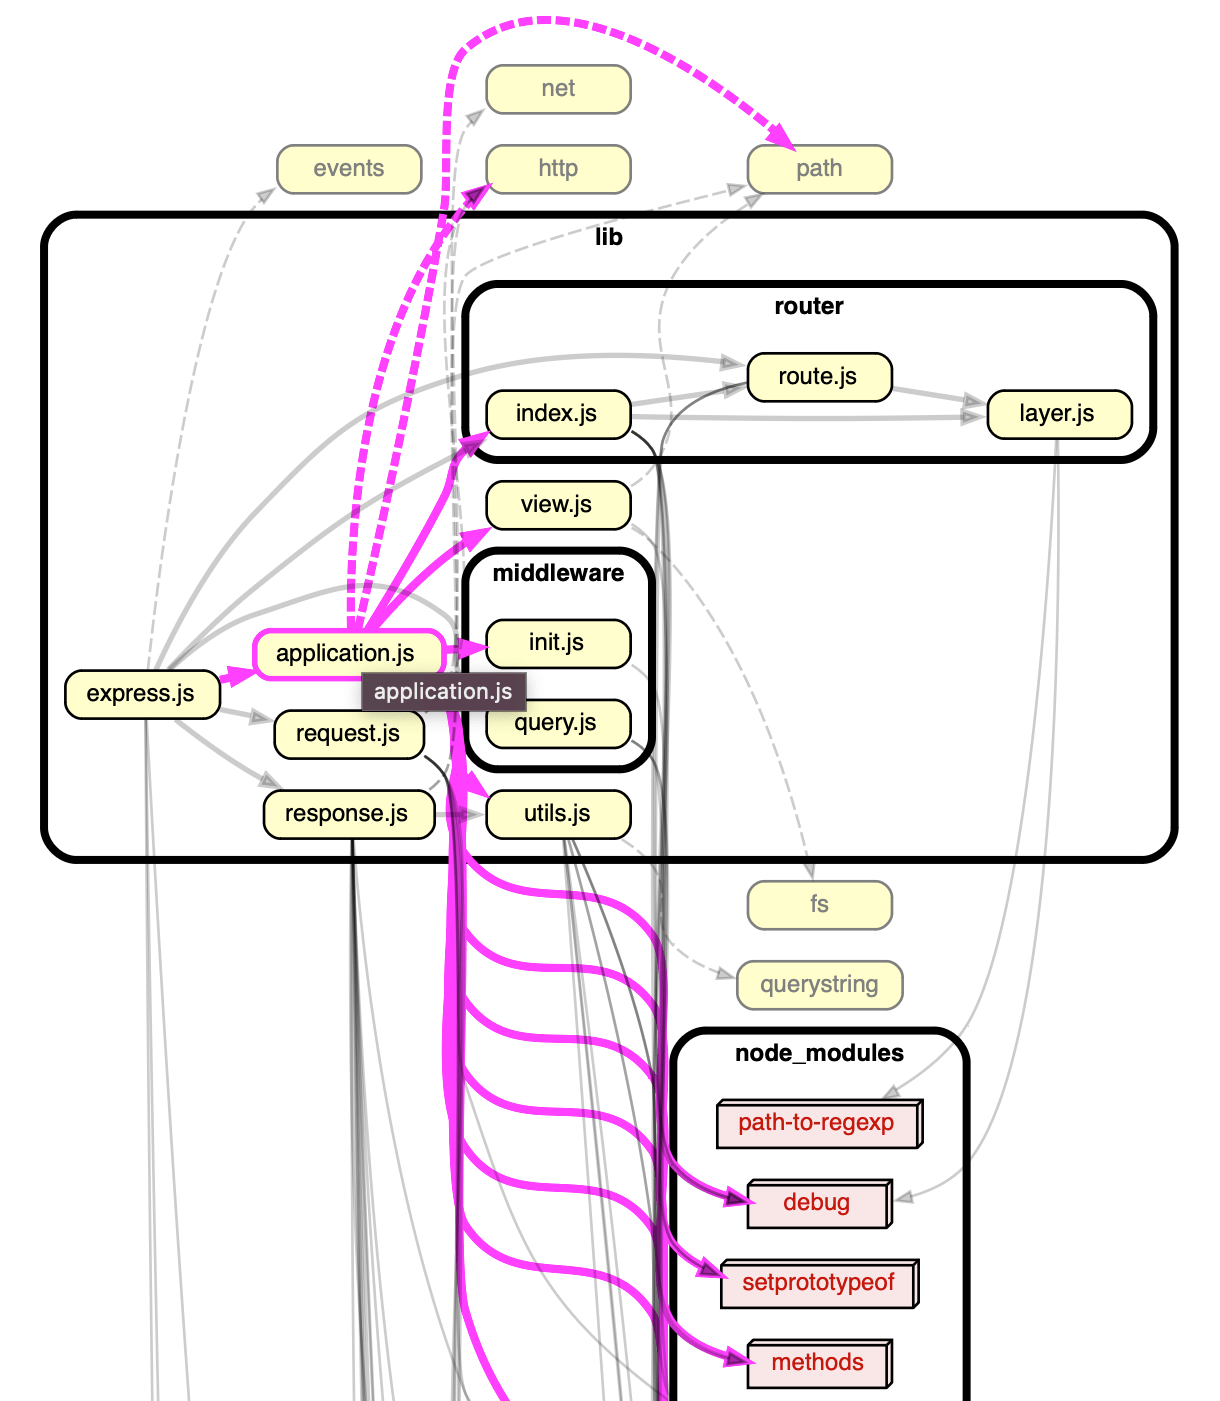
This report is great because we can roll over each module and see incoming and outgoing dependencies! Both the directory grouping and navigable HTML report are very helpful on our larger project, as we can more easily follow all the lines, and if you look closely in the center of the screenshot below, you can see an orange highlight of the circular dependency we noticed before.
Additional Features
While we are focused on visualizing our architecture in this article, Dependency Cruiser offers a lot more than just visualization. You can set best practices and custom rules that can be integrated into your build process. This could be something like preventing specific directories or files from having direct dependencies on another directory or file. For example, in the Express dependency graph we can see that files in router do not have any internal dependencies. We could enforce this using a custom rule that would break the build if any future commits broke this rule. Or we might simply want to make sure none of our application source code has dependencies on anything in our test folder.
Conclusion
While Madge does a nice job of giving us a quick way to visualize our application architecture, I think Dependency Cruiser’s navigable HTML report, robust options for customization, and the support of validating dependency rules as part of our CI process give it a big advantage over Madge.
An honorable mention goes to Skott , which also produces a navigable HTML report with a nice UI and adds some useful summary information:
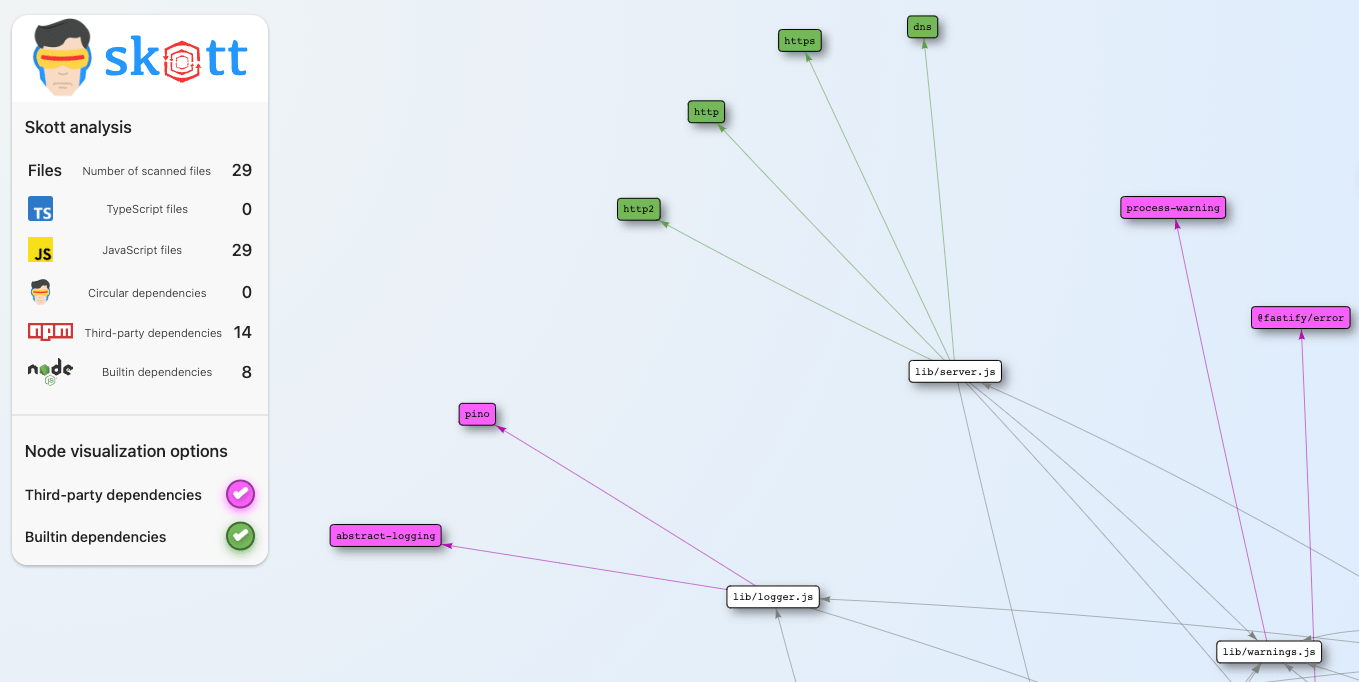
By default, Skott runs its own local server rather than generating a static report, though it says it can generate some static files. Overall I found the report harder to read and use than Dependency Cruiser. Skott also claims to be able to identify unused dependencies and “dead code” but I did not have time to test these features.
In general, Dependency Cruiser seemed to have the most well-roudned feature set, and I really liked the ability to set rules and validate code against them.
Moving Forward
In our first post , we started at 40,000 feet, using tools to help us get a sense of the size of our codebase in terms of number of files, lines of code, and where everything “lived.” In this post, we zoomed in just a bit, trying to understand how the various pieces of the application fit together into an architecture.
At this point I think we are ready to do a little more analysis to try to find important and/or problematic areas of the codebase. In our next post, we will take a look at some tools to do just that!